
Hotcake Slough - Main Gallery
Date Observed: Oct 1, 2011 to Apr 30, 2013
|
At this study site in Hotcake Slough, we monitored the vertical temperature profile from the groundwater upwelling, through the water column, ice, snow, and into the air. In 2012, we monitored the temperature in three different locations. The upper site is typically covered with snow and ice and the middle site is typically ice free, while the lower site is in a transition zone that is often covered in ice, but throughout the entire winter. Processes Observed |
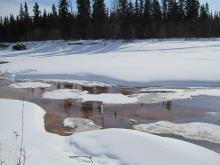
During the winter in Hotcake Slough, groundwater upwelling is the sole source water in the channel because the river water level drops lower than the deepest part of the channel in the slough. The warm groundwater upwelling maintains ice-free areas in the slough through most of the winter despite very low air temperatures that may reach -50 F. Processes Observed |
Date Observed: Jan 9, 2012 to May 7, 2012
|
Photo Credits:
Chas Jones This time-lapse video shows how conditions at the Hotcake Slough - Main study site changed through the 2012 winter to spring season. It shows how conditions can change very rapidly. Processes Observed |

Date Observed: Feb 6, 2012
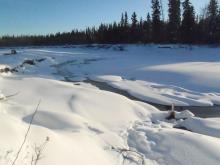 Photo Credits:
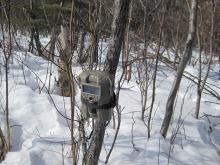
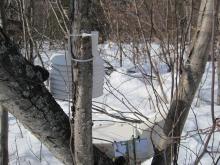
Chas Jones Location in Hotcake Slough where scientific instruments have been installed to monitor temperature, groundwater, ice and snow. Portions of Hotcake Slough remain ice-free in most years. Processes Observed |
Date Observed: Mar 31, 2012
 Data loggers at Chas Jones' study site record the temperature profile from the groundwater, through the water column, ice, snow and into the air to better understand how groundwater can control river ice thickness. Processes Observed |
Chas Jones explains the equipment used to gauge the water and snow level and temperature profile of the sediment and water column at his study site in Hotcake Slough. Processes Observed |
Chas Jones explains the equipment he uses to measure specific conductivity, water level, and water temperature at his study site in Hotcake Slough. Processes Observed |
|
Chas Jones takes water depth readings at his study site to be used in calculating the rate of groundwater upwelling. Processes Observed |
Chas Jones discusses groundwater upwelling around his study site. Processes Observed |
Chas Jones explains some of his scientific findings, and why he chose this location in Hotcake Slough as a study site. Processes Observed |
 Time lapse photography is used to monitor conditions at Chas Jones' study site throughout the winter. Processes Observed |
 Scientific monitoring equipment at Chas Jones' study site used to collect air temperature for analysis of river and ice dynamics throughout the year. Processes Observed |


Date Observed: Dec 3, 2012
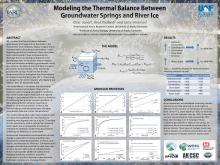 Initial research results from Tanana River monitoring sites presented in a poster titled "Modeling the Thermal Balance Between Groundwater Springs and River Ice" prepared by Chas Jones, Knut Kielland, and Larry Hinzman from the University of Alaska Fairbanks for the American Geophysical Union Annual Meeting, December 2012. Processes Observed |
Date Observed: Feb 11, 2013 to Jun 1, 2013
|
Photo Credits:
Chas Jones This time-lapse video shows how conditions at the Hotcake Slough - Main study site changed through the 2013 winter to spring season. It shows how conditions can change very rapidly. Processes Observed |
